

Start with the current report
The current provider report is the July 30 warm-operation report. It compares six warm operations. Each result cell contains 30 successful samples. The chart compares complete warm-operation paths. The tested setups differ.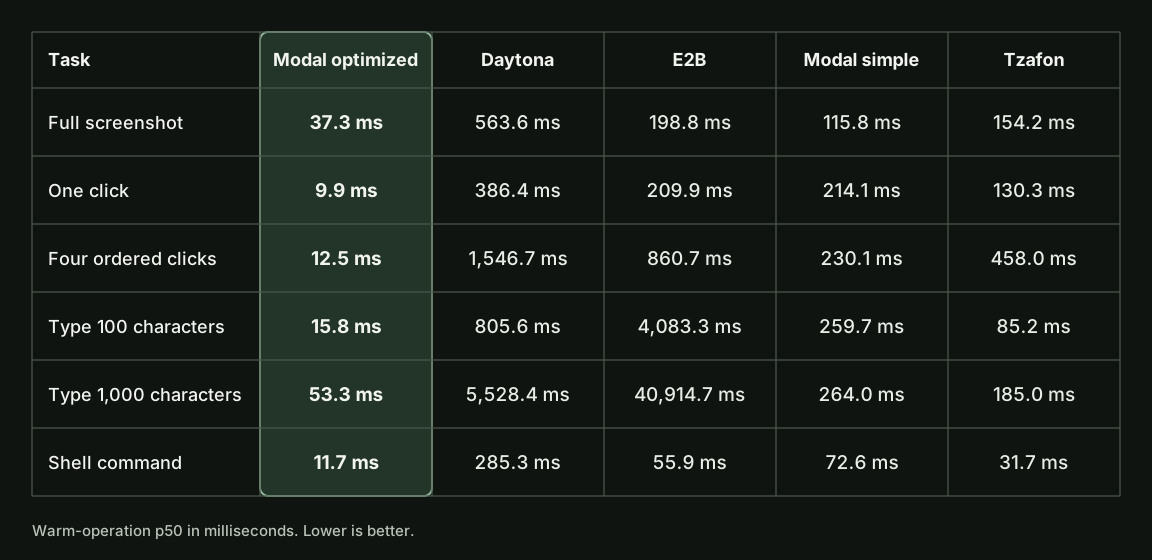
Choose the right page
Run a benchmark
Select a credential-free or live benchmark command.
Current results
Read the July 30 warm-operation table and its limits.
Latency evidence
Review batching, subprocess, native X11, and cost evidence.
Reproducibility
Check source state, samples, validation, cost, and cleanup.
Read a result correctly
For 20 or more successful observations, reports show p50 and p95. The implementation uses rank0.95 * (n - 1) and linear interpolation for p95. For fewer than 20 observations, use the median and the observed range instead of p95 as headline evidence.
Do not compare values with different timer boundaries. Keep these boundaries separate:
- Sandbox creation and readiness
- Action acknowledgement
- Immediate screenshot capture
- Hash-confirmed first visual change
- Application readiness
Evidence locations
The benchmark procedure owns the run and reporting rules. The benchmark data policy owns tracked artifact eligibility. Tracked, sanitized evidence is inbenchmark-data/. Raw output, candidates, rejected runs, and replay inputs stay in ignored benchmark-results/.
A tracked artifact can support a narrow claim without replacing an earlier result. Check its status, scope, and limitations.